What Is Sell-Through Rate — And How to Use It to Make Better Buying Decisions

Sell-Through Rate: The Inventory Metric That Should Drive Your Next Buy
TL;DR: Most founders know how to calculate sell-through rate. Far fewer use it to make buying decisions. This post covers what sell-through rate is, what a healthy number looks like by product type and channel, why a 10-point difference in your sell-through target matters more than it sounds, and how to use this metric before dead stock becomes the problem you're solving.
Sell-Through Rate Definition and Calculation
Sell-through rate measures the percentage of inventory sold over a specific period, relative to the total amount you received.
Sell-Through Rate = (Units Sold ÷ Units Received) × 100
Receive 500 units, sell 350 in a given period: your sell-through rate is 70%.
Simple formula. The complexity is in what you do with it.
Sell-through rate shows up in weekly reviews, monthly deep dives, and seasonal assortment analysis. It almost always plays a supporting role: a checkpoint, a flag, a sanity test, but it is a key metric to review in trying to keep your inventory under control. Most brands highly under-utilize this valuable KPI.
How to Analyze Sell-Through Rate: It's Not One Number, It's Several
You will sell through all of your inventory eventually. (You kinda have to) Carry-forward core styles aside, that's not the question. The question is at what price and in what timeframe, because those two variables determine whether your inventory spend worked for you or against you.

Chasing 100% sell-through at regular price is not a goal worth pursuing. If you hit it, you almost certainly didn't buy enough.
You left sales on the table and sent customers elsewhere. Some markdown exposure is a normal, healthy part of running a product business.
Plan around your regular-price sell-through target. What does your revenue look like if you sell through 90% of a style at regular price? Run the same math at 80%. Ten points might feel like a rounding error as a percentage. In actual dollars and units, across a real assortment, the swing is almost definitely not small.(ahem, this kind of analysis is one of our specialties at Boon)
Time is the other variable. Hitting 80% sell-through in two months is a completely different result than hitting it in eleven. A slow path to 80% ties up capital longer than planned, limits open-to-buy for the next season, and creates cash flow problems that compound fast.
What a Healthy Sell-Through Rate Looks Like by Product Type and Channel
No single sell-through rate tells you a business is healthy. This is where founders get tripped up comparing their numbers to benchmarks that don't fit their product type or channel.
Fashion and trend-driven product typically targets regular-price sell-through in the 70–85% range within the primary selling window. Some markdown exposure is planned. The goal is knowing how much before you buy inventory, not after.
Core and replenishment styles should run higher, often 85–95%+, but on a rolling basis. Reordering is always an option, which means low sell-through on a core item is a more serious signal than the same number on a seasonal piece.
Marketplace inventory needs its own targets. Once units arrive at a fulfillment center, your flexibility is gone. A sell-through slowdown on Amazon, for example, can suppress your listing ranking and force ad spend to dig out. The cost of getting it wrong there runs higher than anywhere else.
Set sell-through targets by SKU type and by channel. A blended number for the whole assortment is not a strategic inventory plan.
Sell-Through Rate Scenario Planning: What a 10-Point Difference Does to Your Margin
Planning a seasonal buy: 1,000 units at $25 cost, $85 regular-price retail. You're deciding between a 90% and 80% regular-price sell-through target.
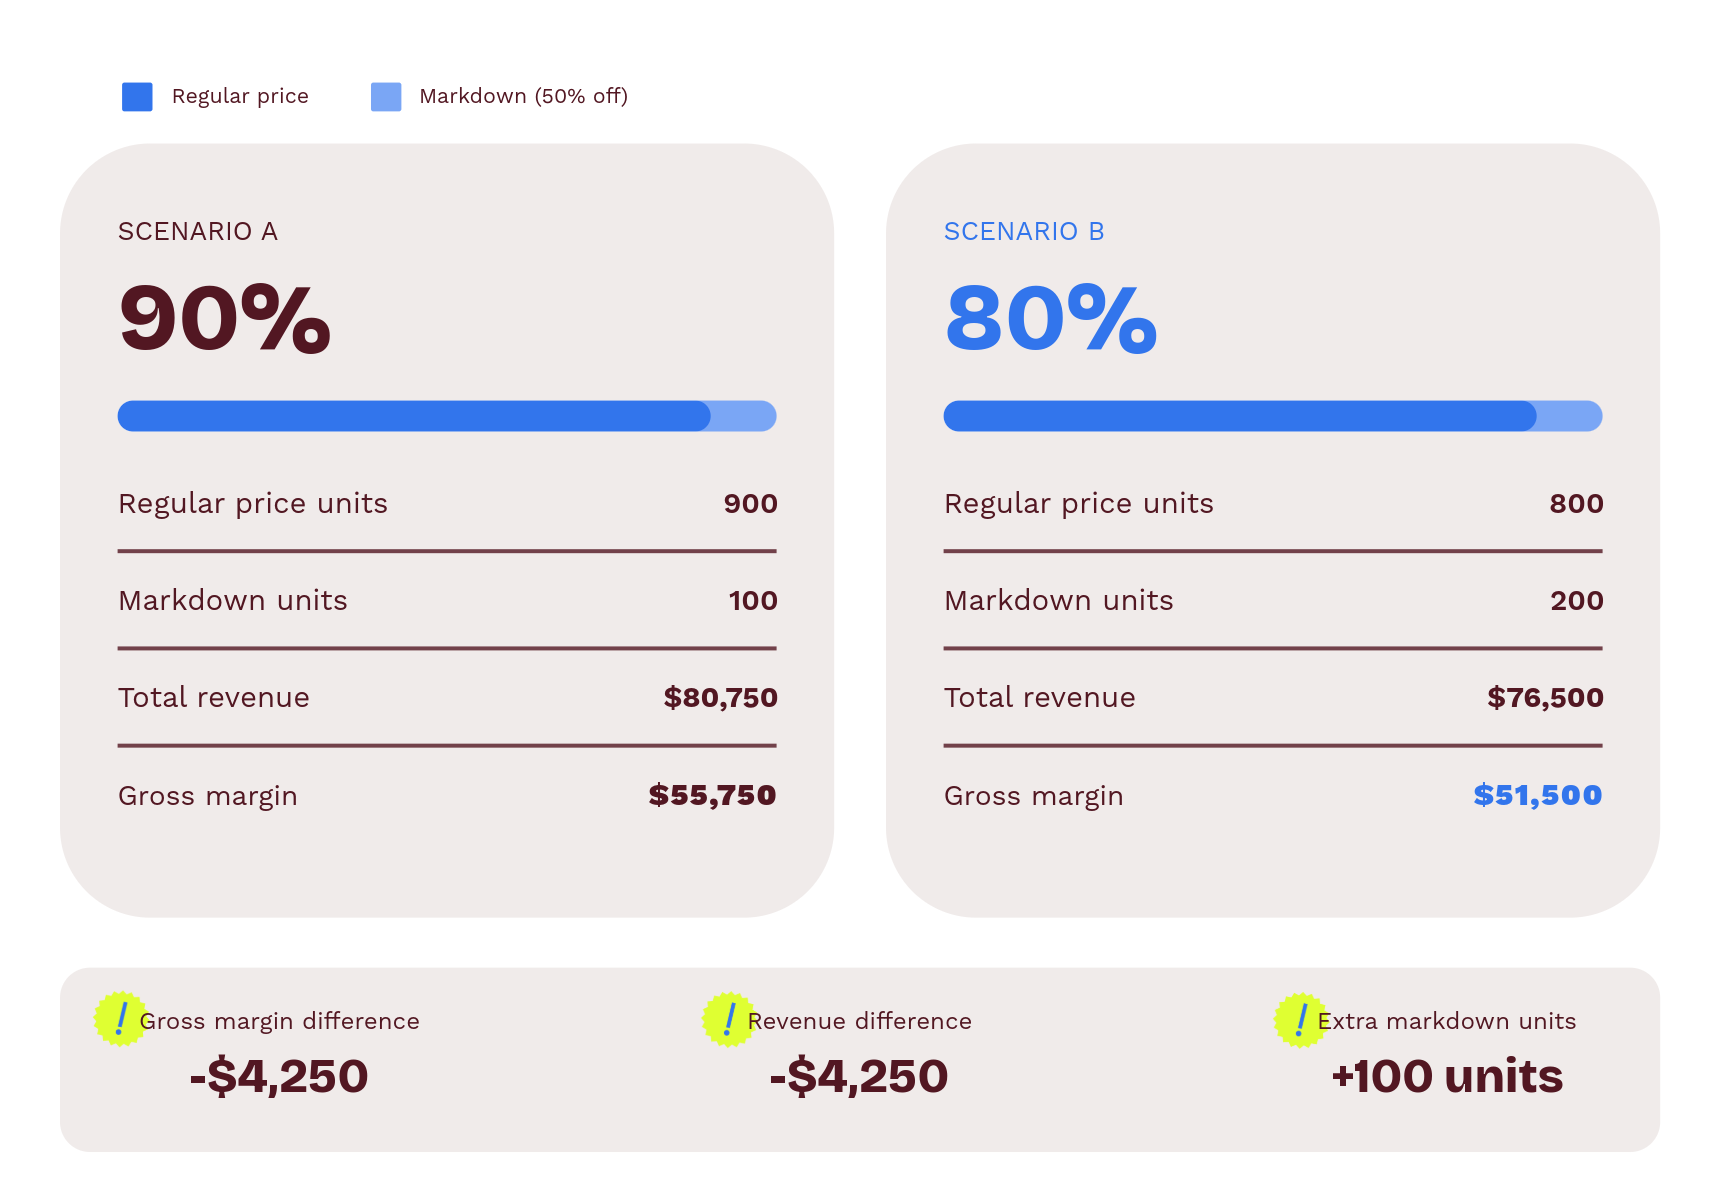
At 90% regular-price sell-through: 900 units at regular price + 100 units at 50% off = $80,750 total revenue / $55,750 gross margin.
At 80% regular-price sell-through: 800 units at regular price + 200 units at 50% off = $76,500 total revenue / $51,500 gross margin.
$4,250 difference in gross margin for just one SKU. A decision essentially made before a single purchase order goes out.
Across a 50-SKU assortment, that assumption gap becomes a real profitability problem. And it doesn't account for what happens when 80% takes eleven months instead of three. Those 200 markdown units sit in a warehouse for most of the year. It’s capital you can't use to fund the next buy, or replenish top sellers. The rate tells you one thing and the timeline tells you the rest.
How to Diagnose Low Sell-Through Rate Before It Becomes a Dead Stock Problem
Low sell-through is not always a demand problem. Rule out the inventory problem first.
Not all low sell-through is a demand problem. Before you pull the trigger on a markdown or cut a SKU from the next buy, figure out what actually happened.
An item that sold out in week four of a twelve-week selling window and landed at 95% sell-through isn't a clean win — it left eight weeks of potential sales on the table because you didn't buy enough. That's a buying problem. Next season, you go deeper.
When the product was available the whole season and still didn't sell, there are three likely causes. The product missed the market: trend, colorway, fit, price point. If it's underperforming in its second or third season, cut it. The sales channel didn't fit: a DTC winner can stall on a marketplace where you can't adjust pricing and the customer finds you differently. The buy was too deep: the product is fine, you just over-committed. Each cause requires a different response. Getting the diagnosis right is the work.
A consistent pattern of trending-down sell-through, even while you're hitting targets, signals softening demand before it shows up in sales numbers. Catch it in your monthly review, before the next buy is locked, and you can do something about it. Wait, and you build the next season on numbers that stopped being true three months ago.
Start Using Sell-Through Rate to Make Smarter Inventory Decisions
Sell-through rate sitting in a dashboard nobody opens until something goes wrong is not a planning tool. It's a post-mortem KPI.
Review it at the item level, on a consistent cadence, with enough lead time to change what you buy next. That's when it starts protecting margin instead of just measuring it.
Book a call with Boon to walk through your current setup.